Drilldown Reports
Brief Review
Drilldown Report represents a multilevel report, where you can simultaneously examine aggregated data on top levels and more detailed, granular data on bottom levels.
It’s designed to help you investigate various aspects of your affiliates' activity, covering everything from clicks to billing reports. The scope of data is selected via Groups.
At its core, the Drilldown Report is highly customizable: It utilizes Metrics to form columns to describe all instances of groups. Metrics can be either original or modified parameters.
Fine-tune the report by enabling the Flat Mode to disable hierarchy of groups, or by filtering the data via a diverse variety of Conditions and Quick Filters.
In This Article
This article provides an in-depth review of a series of Drilldown features. Use the shortcuts in the sidebar to navigate directly to topics of interest.
Groups
Managing several marketing campaigns can become complex and produce a lot of data at any step of a campaign. Thanks to the groups, Drilldown Report can put focus on any stage of your business and help to highlight its relations to other stages.
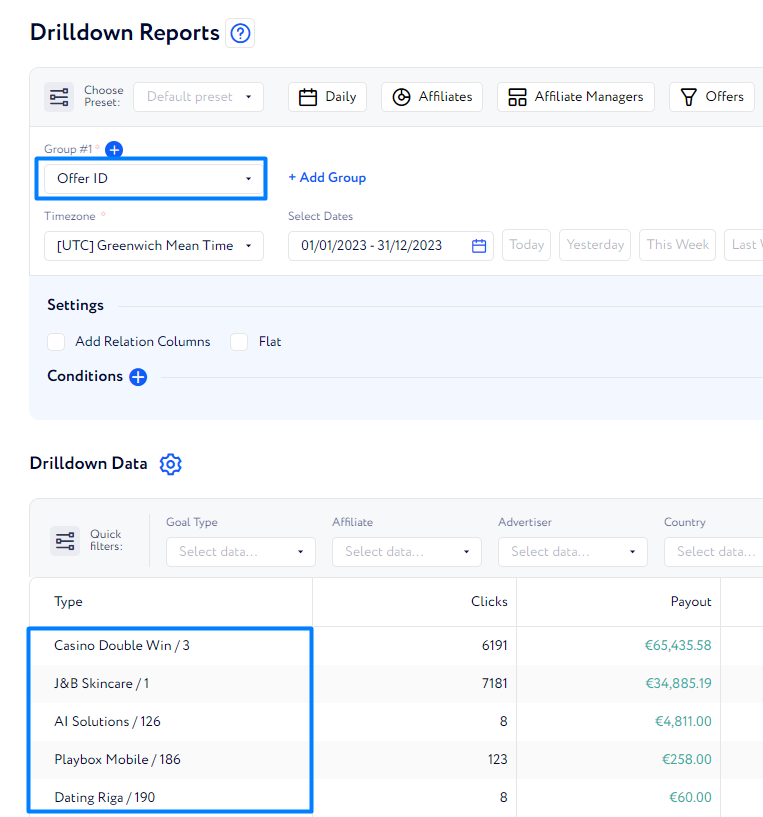
With a group, you can define the subject of the report. For each selected group, the table will be filled with all instances of the selected group.
For example, if you selected the Offer group, all offers that fit the report restrictions will appear in the report table.
Combining Groups
Combining several groups imposes hierarchy: every group aggregates the data of the following groups. groups can be expanded to review granular data till the last added group is reached – it can’t be broken into more detailed data.
Example
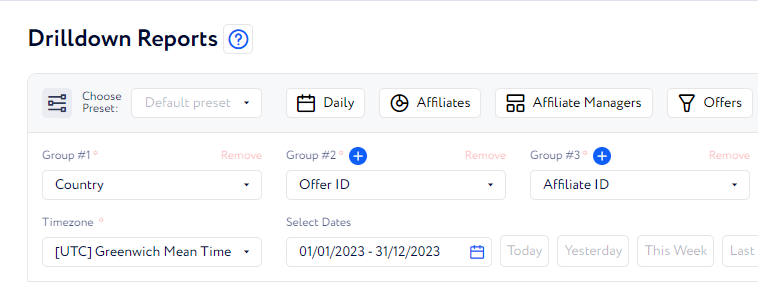
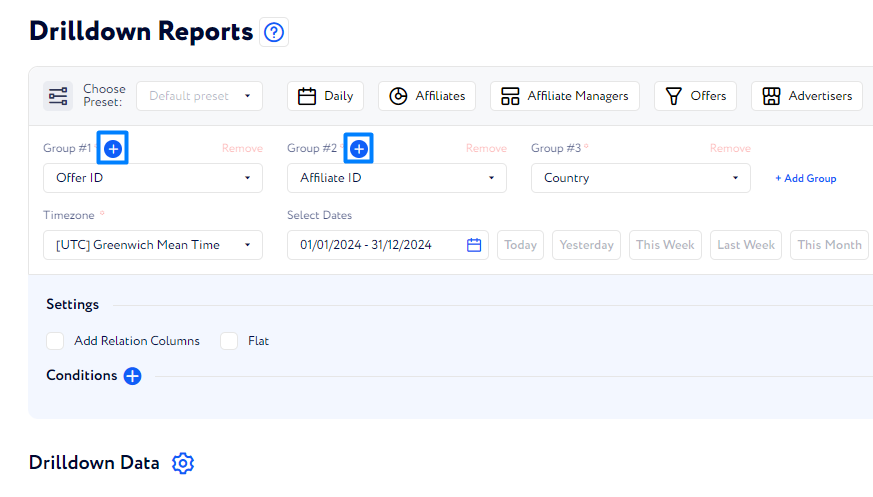
Lets select these three groups in the following order:
Country
Offers
Affiliates.
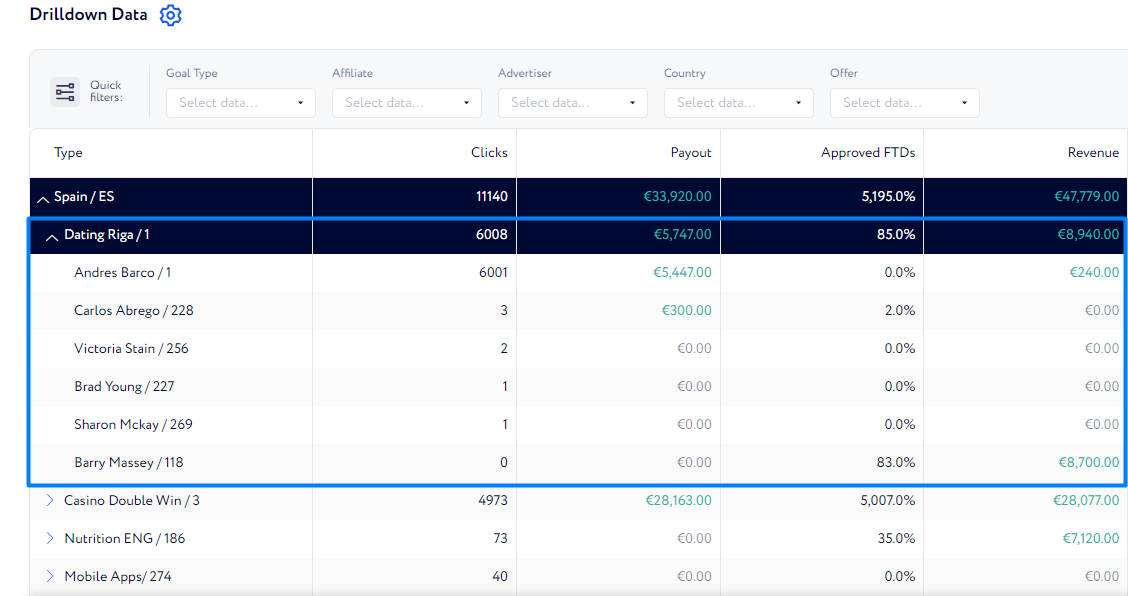
You will get a report aggregated by country. Select a country and click on it to see a detailed report on each offer accounting for data in that country.
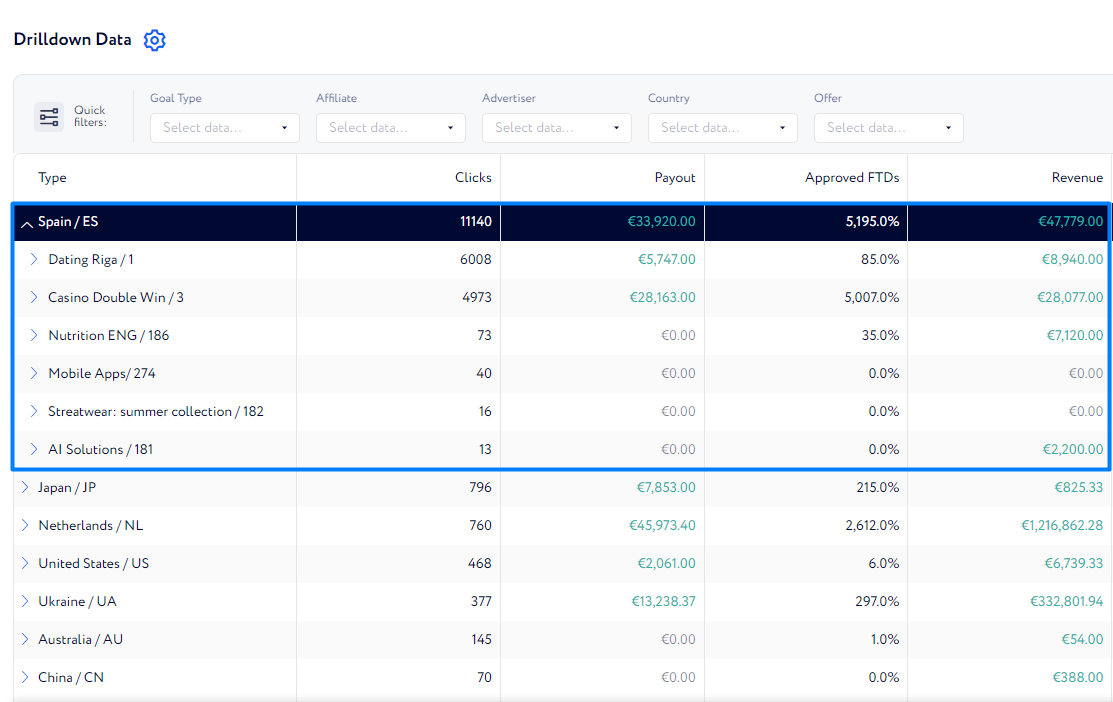
Finally, in the list of offers under the selected country, you can click on an offer to expand it’s contents and see the relations to affiliates.
You can apply any number of groups for a single report.
Relation Columns
This tool, just as metrics, is used to add columns to the report and populate them. While metrics describe highly customizable attributes, relation columns pull the default set of attributes of specific groups.
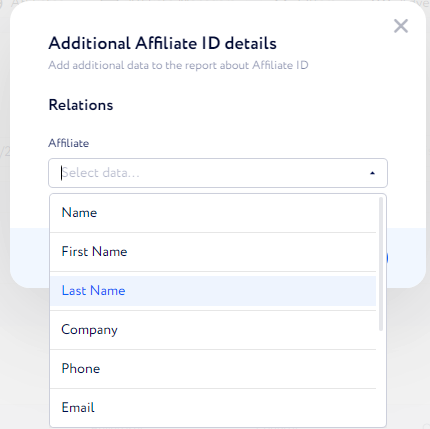
For example, when being applied to the Affiliate Group, relation columns allow you to add to the report attributes from the Affiliates table.
How to display Relation Columns?
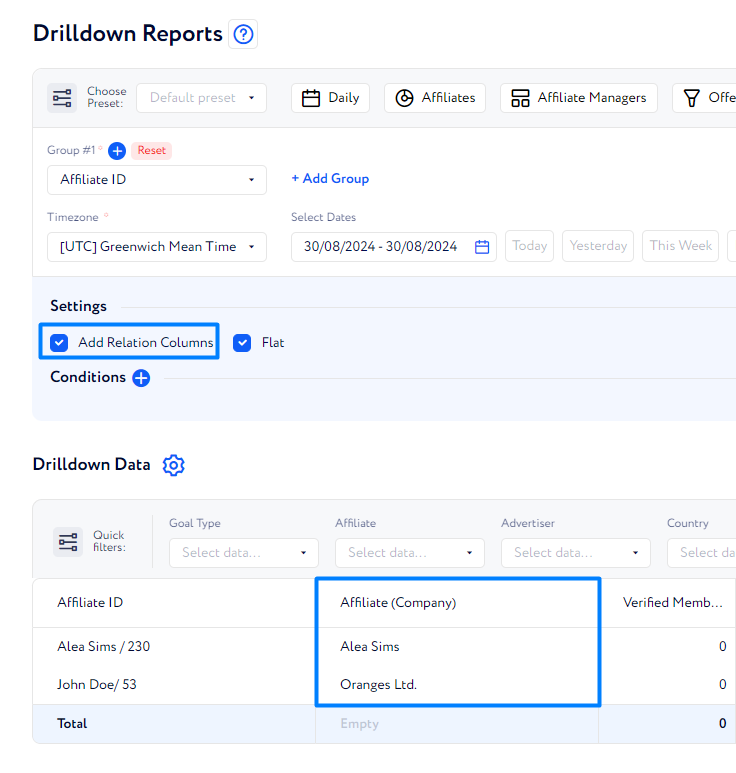
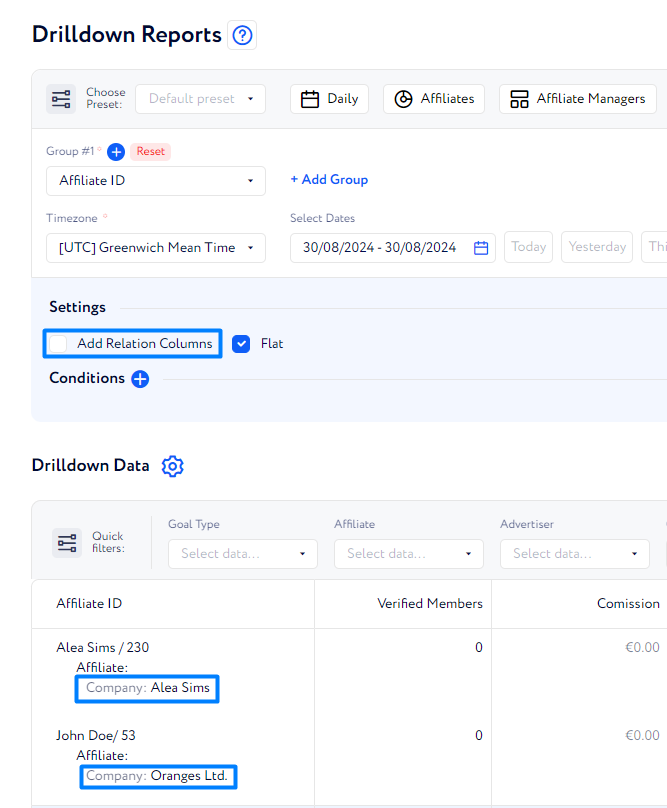
There is a special setting that regulates how to display such columns in the report. It’s called Add Relation Columns.
When it’s enabled, the relation columns are added in the table as separate columns.
When it’s disabled, all the relation columns are listed in the first column.
Limitations
This tool is complementary, and it’s only available for the following groups:
Offers
Affiliates
Advertisers.
Date
You can restrict the scope of data by selecting an allowed timeframe. There are two ways to do it:
Select two boundary dates of the timeframe.
Use quick buttons like Today or Current Week.
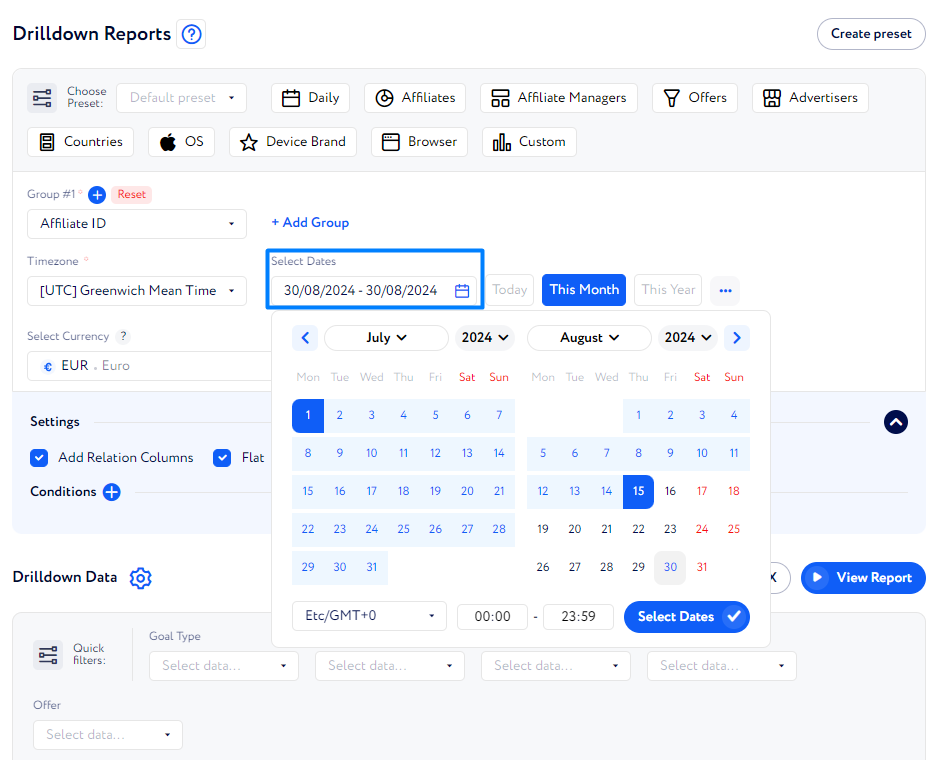
Boundary Dates
Click the Select Dates field to open a calendar widget. Here you can select two dates in different months and even select a certain hour.
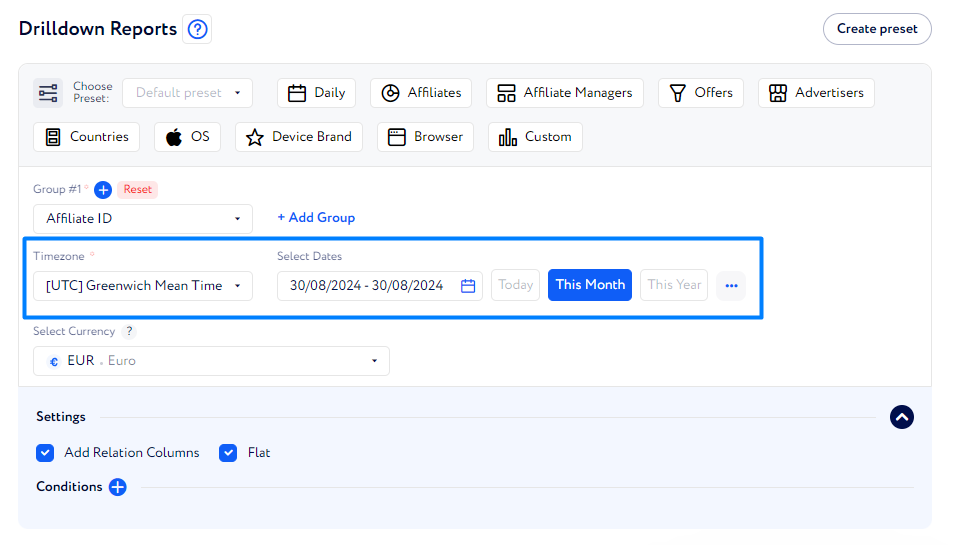
Quick Buttons
Click the buttons that are placed to the right of the Select Dates field. The date in that field will adjust in accordance with the selected period.
Metrics
Metrics have a substantial role in the Drilldown Reports – they define how to evaluate and compare items in the report. In other words, each added metric creates a new column in the report.
Background
In general, metrics are an independent group of settings with broad customization opportunities, and they can be used in various sections of the CRM. To learn more, visit this page.
In this article we will only cover application of metrics to the Drilldown Report. To learn how to make specific metrics available for the usage, visit this page.
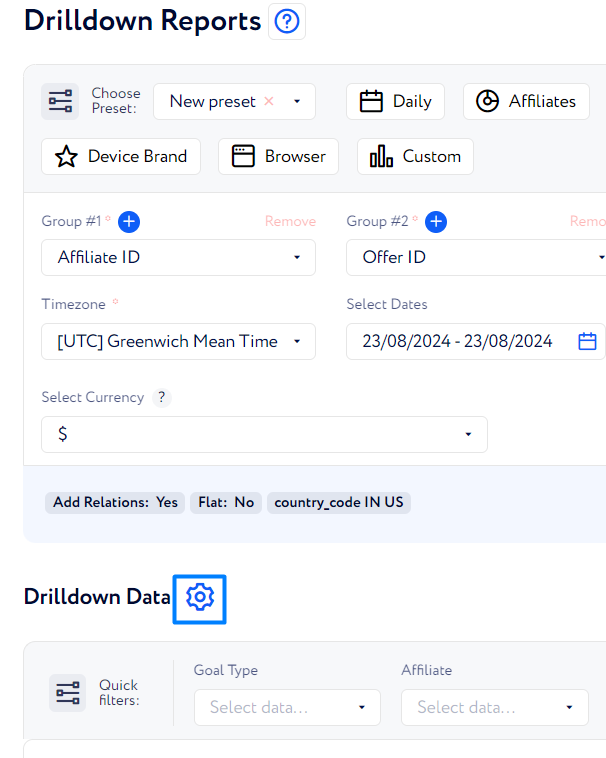
How to select metrics for a report?
Scroll down to the Drilldown Data and click the Gear button.
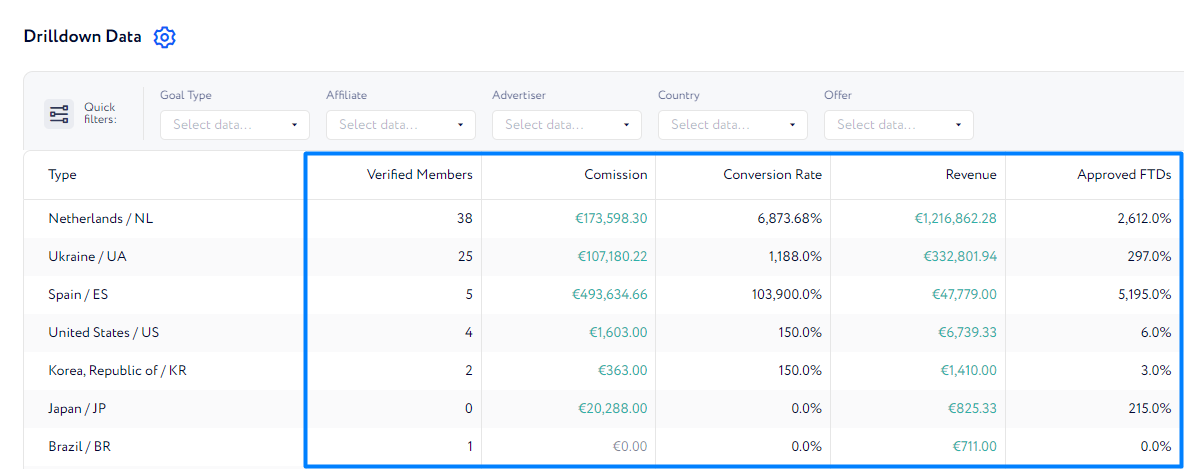
The list of metrics appears. Select metrics that will be used in the report by checking the boxes. Here you can drag items to change their order: the higher the item the closer the column will be to the left side of the table. Then click submit.
As a result, the columns will be formed in the report.
Conditions
At times, you look not for the entire scope of data but rather for a strictly specified range of data. Conditions are designed exactly for that purpose.
Conditions allow you to set specific limitations to the data in the report. Each condition consists of three parts:
Field – choose a parameter by which you want to limit the data in the report.
Sign – choose whether to include or exclude the selected value from the report.
Value – dynamically adjusts to the selected field and provides actual options.
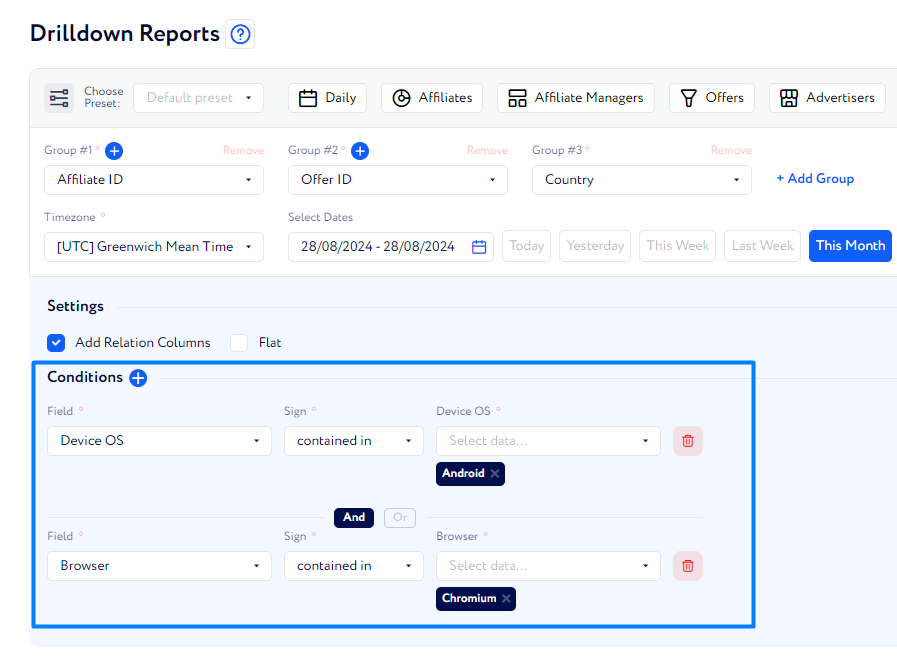
Example
Let's find only the data that is related to the Android devices and the Chromium browser.
As we have two conditions, let's click the plus button twice; each condition has its own fields.
To select conversions only related to the Android OS, choose the following configuration:
Device OS in the Field
Contained In in the Sign
Android in the Value.
To configure our second condition, lets choose the following configuration:
Browser in Field
Contained In in the Sign
Chromium in the Value.
With these conditions, the generated report excludes all the data that’s not related to the selected OS and browser options.
Review Drilldown Report
Flat Mode
The Flat Mode completely changes the report structure. In this mode, hierarchy doesn’t matter: rows don’t expand into a group of subordinate rows with more detailed data.
Instead, each new group adds a new column to the table. Each row of the table represents a unique combination of groups.
For example, when we select the Offer and Affiliate Groups, this is how the table looks:
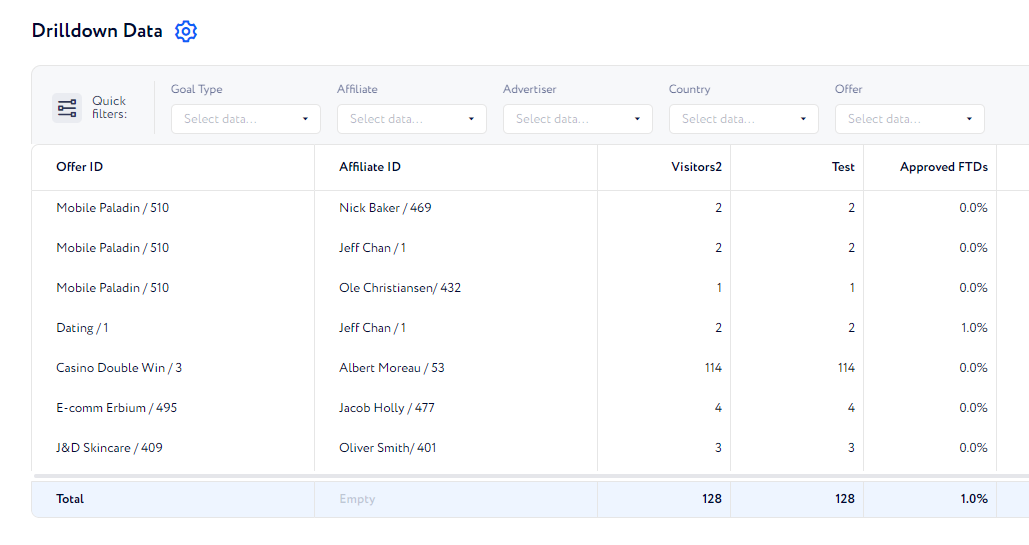
The Flat Mode doesn’t affect Related Columns and Metrics in any way.
Quick Filters
You already know that to limit the range of data, you can use conditions. They work well, but they might be too complicated for small tweaks, especially when you need it during operation. It’s much better to use Quick Filters to segment data dynamically.
In addition, Quick Filters contain fewer parameters, but focus on the most popular ones: Goal Type, Affiliate, Advertiser, Offer, and Country.
How to use Quick Filters?
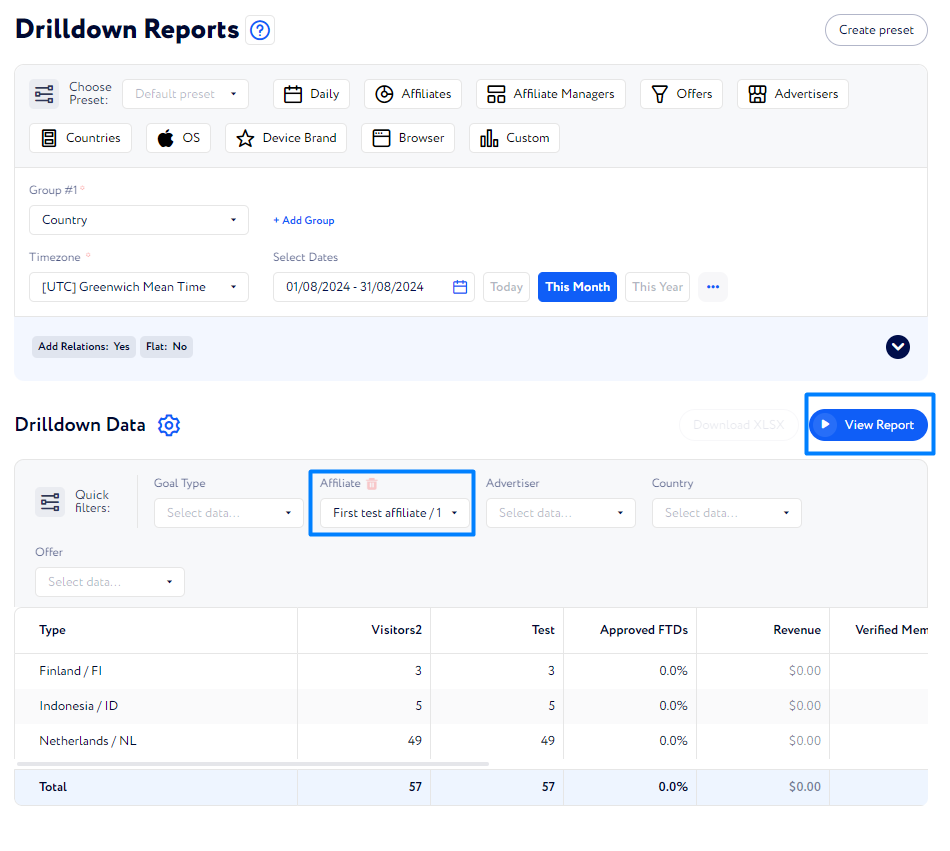
Whether or not a report has been generated, you subtly filter the results using the Quick Filters:
Click any Quick Filter and select an option form the drop-down list.
Click View Report to apply the filters.
If you need to clear a filter, click the Trash Can icon.