
Drilldown Reports walkthrough
In this article you may learn about Drilldown Reports and cases when you can use them.
The Drilldown Reports tab allows you to generate quick count reports with the help of various groups and filters. Unlike Data Exporter, here you can view statistics on total numbers instead of the detailed information.
Drilldown Reports consists of the five report types: Metric Report, Conversions Report, Reject Report, CRG Payout Report, and CRG Revenue Report.
Let us describe each report type one by one.
Metric Report
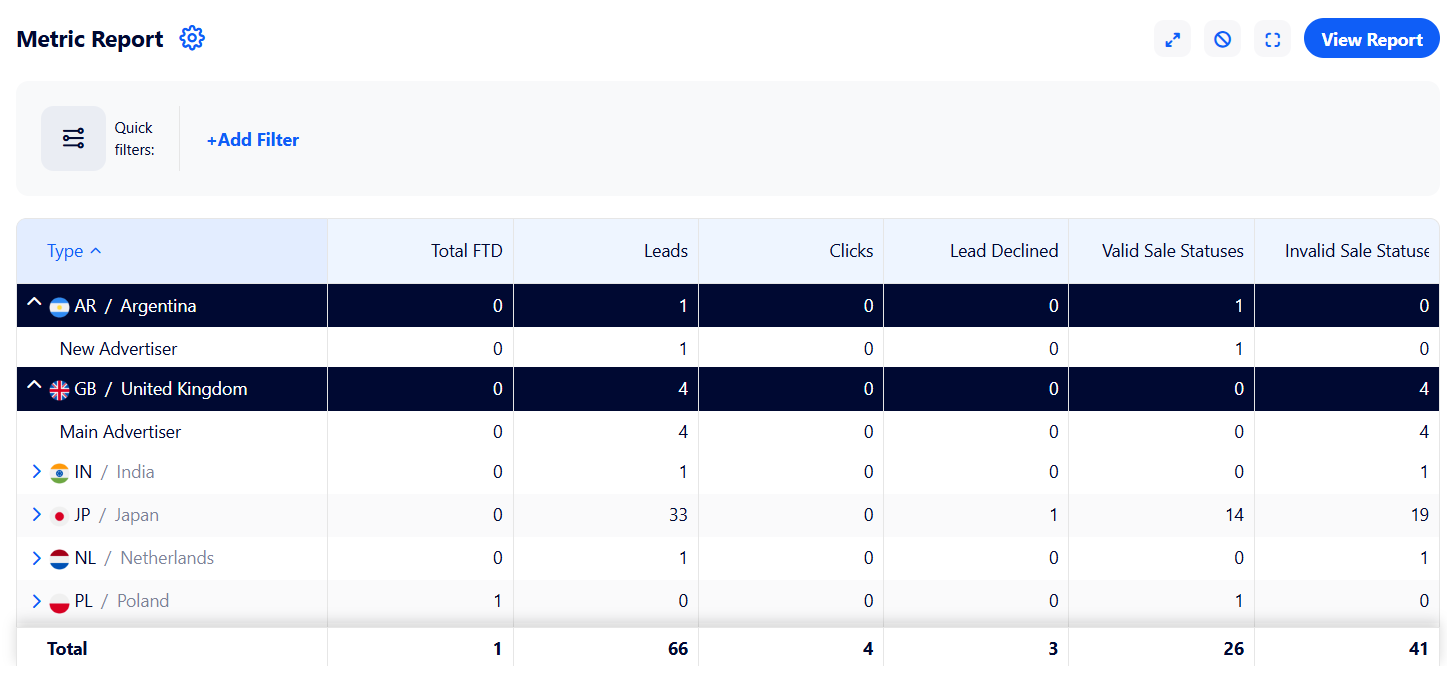
Here, you can create a nested quick report on various metrics such as country, advertiser, funnel, sale status, affiliate, etc. which need to be chosen in the "Group" section.
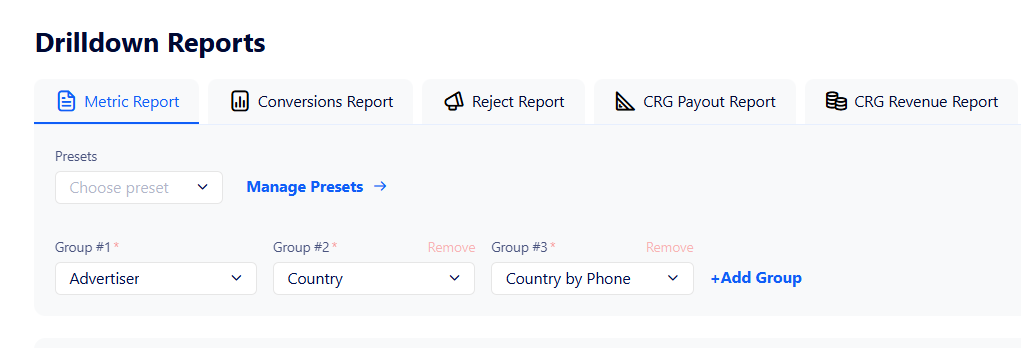
Note: Mind that in the generated report the following group is nested within the previous group. I.e., Group#3 is nested within Group#2, whereas Group#2 is nested within Group#1, etc.
For example, if you set Country for "Group#1" and Advertiser for "Group#2", the advertiser data will be nested within the country as follows:
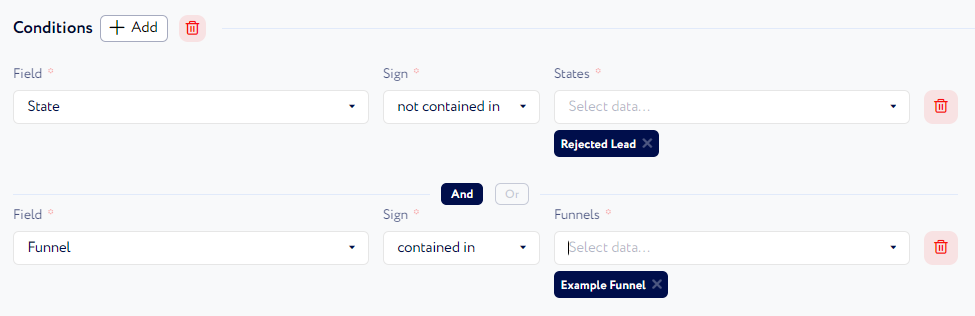
In addition to Group, there is an option to set up conditions to make a report more precise. Besides selecting individual parameters, you can define their cooperation, i.e., if they are considered together (choose And) or either one or the other is considered (choose Or).
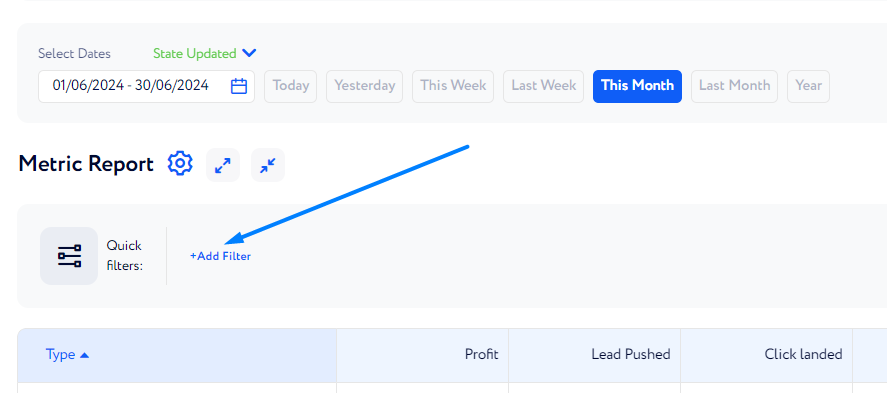
When you are finished customizing your report, you need to choose a time range for the report to be generated.
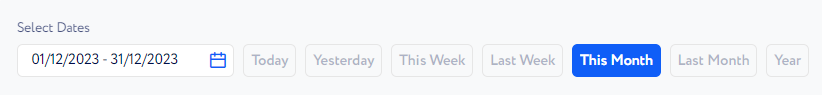
You can select one of the suggested periods (last month, last week, etc.) or set up your own one with the "Select Dates" field.
Additionally, you can apply quick filters to a generated report. They aim to filter the report to study a ceratin part of it.
To add a filter, click the "Add Filter" button as it is shown in the screenshot below.
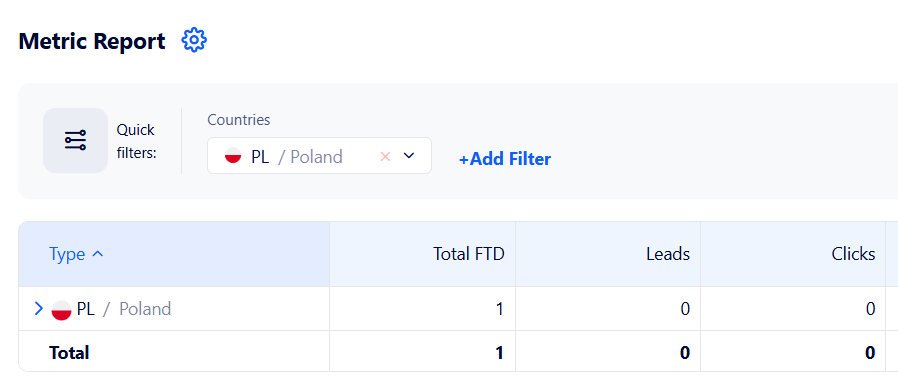
Note: You can select up to 5 filters.
Example: If you want to view a particular country data, add the "Country" filter and select a necessary country.
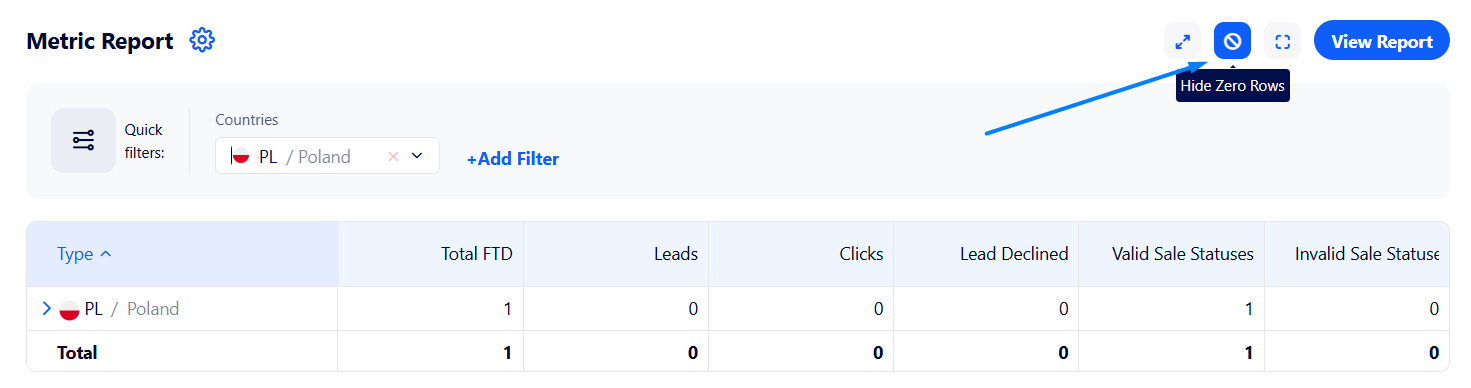
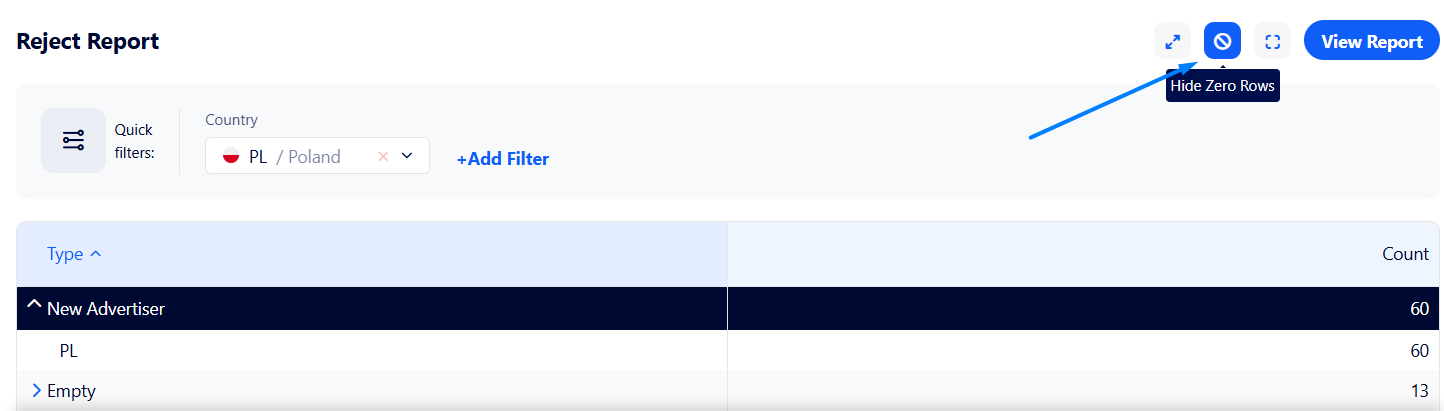
For convenience, there is an option to hide rows containing only zero values. The button appears once you have generated the report:
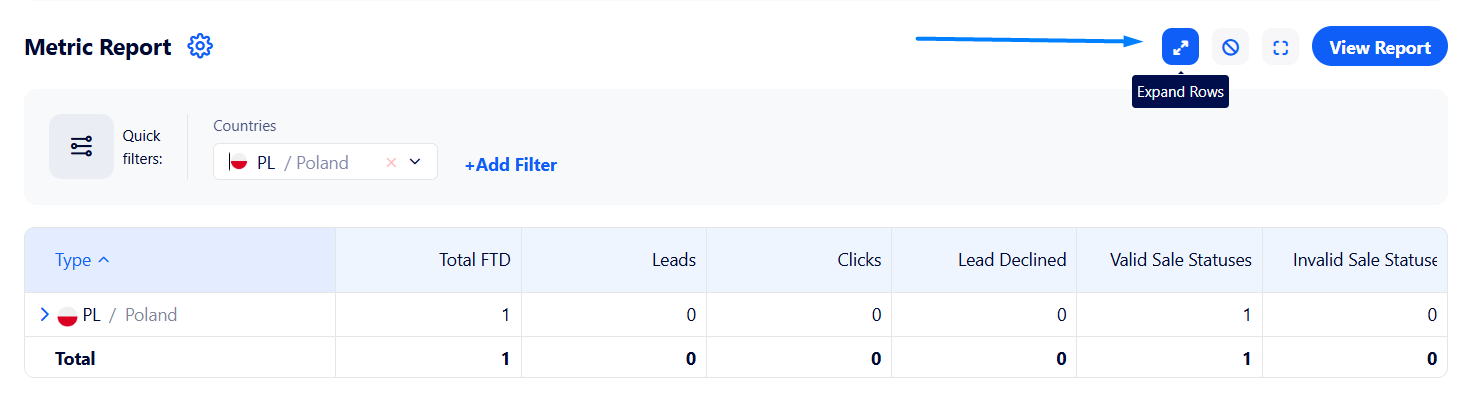
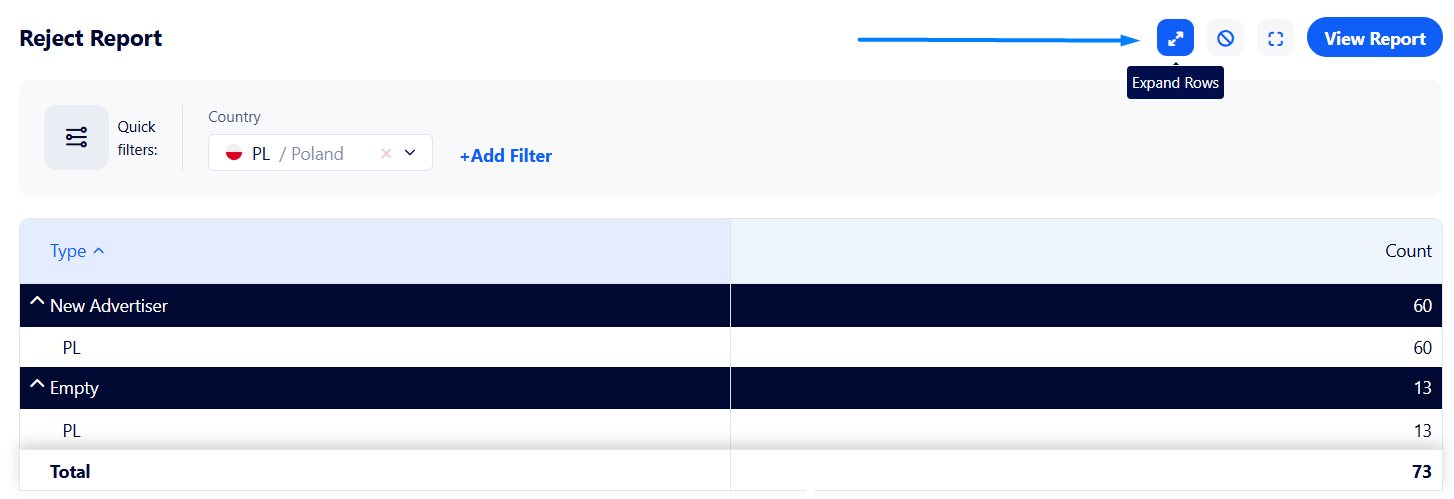
Additionally, you can expand or collapse all nested data in the generated report in one click. You can see the button highlighted in the screenshot below:
Also, you can select what columns to be displayed in the report when clicking the "Gear" button.

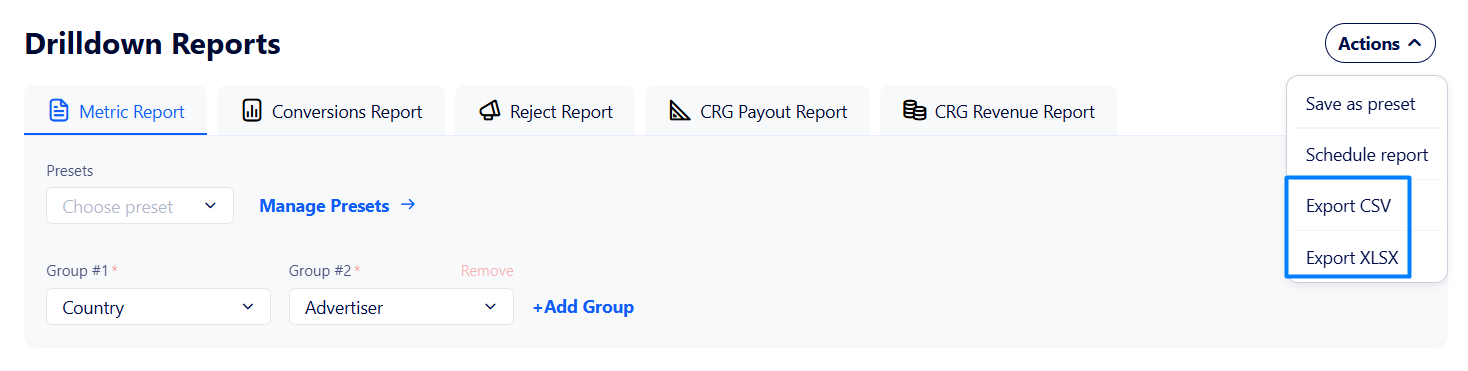
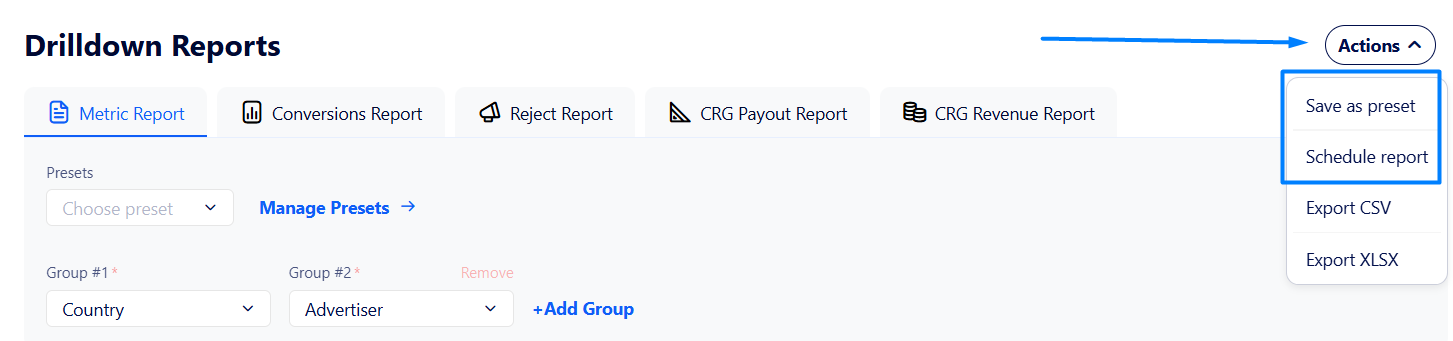
If needed, you can download the generated report in the CSV or XLSX format. To do so, click the "Actions" button at the top of the page and then, select the required option.
Once the file is downloaded, open it in the suitable program to study the report file.
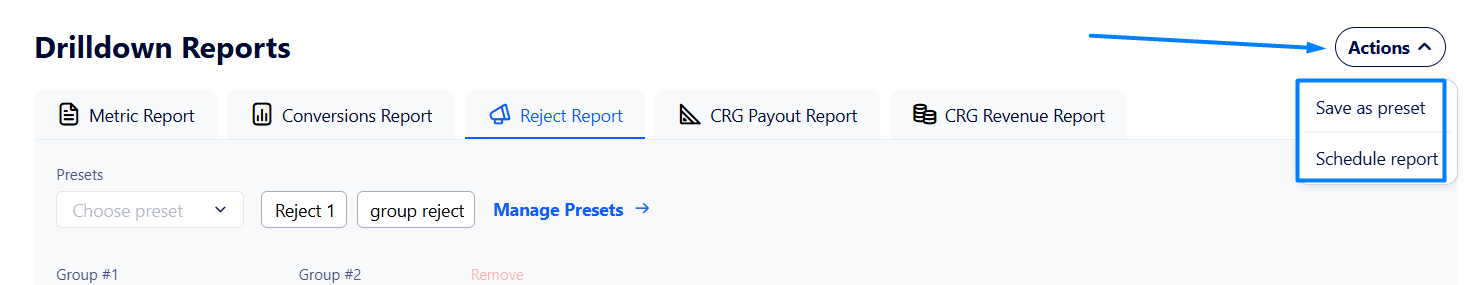
Moreover, you can create a preset based on the created report as well as schedule it to regularly receive updates. To do so, click the "Actions" button and select the required option.
Conversions Report
If you need to view the statistics based on conversions rather than leads, consider generating a conversions report.
The core structure of the report remains the same as Metric Reports, but its settings are adjusted to focus more on conversions.

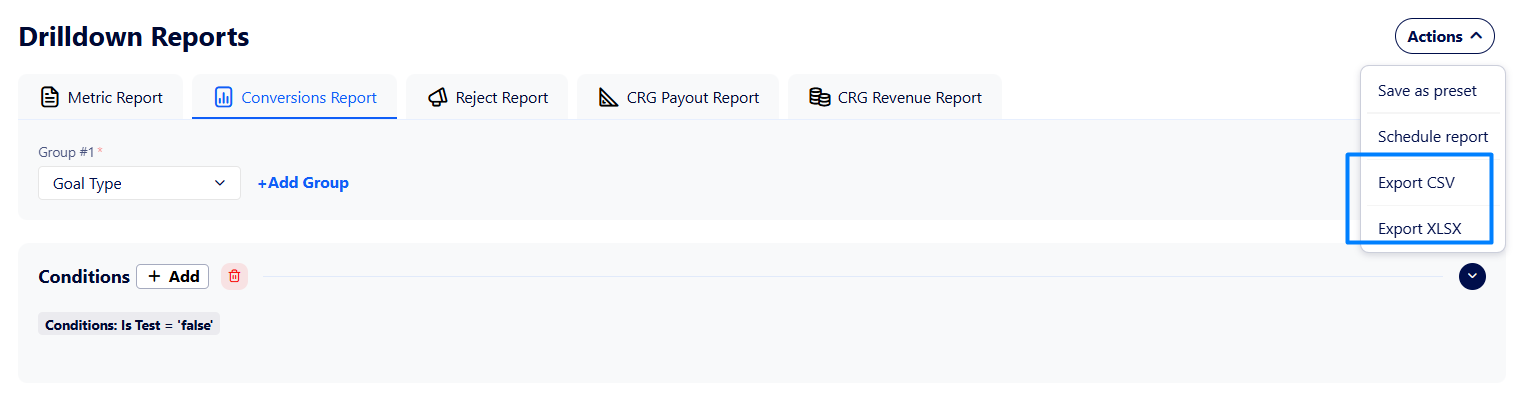
If needed, you can download the generated report in the CSV or XLSX format. To do so, click the "Actions" button at the top of the page and then, select the required option.
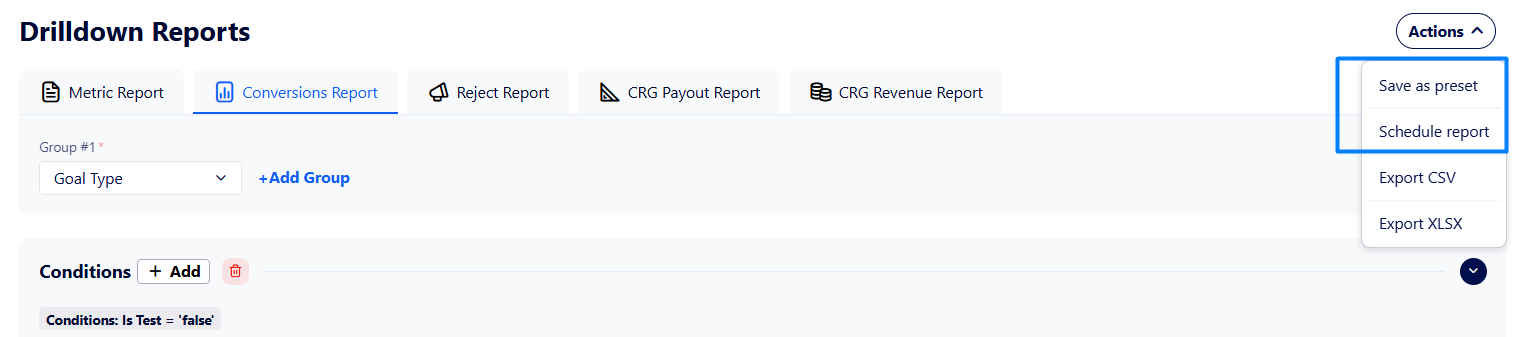
Moreover, you can create a preset based on the created report as well as schedule it to regularly receive updates. To do so, click the "Actions" button and select the required option.
Reject Report
This report type allows you to generate reports on rejected leads count using various criteria such as lead profile items, log types, lead country, etc. They need to be selected in the "Group" section.
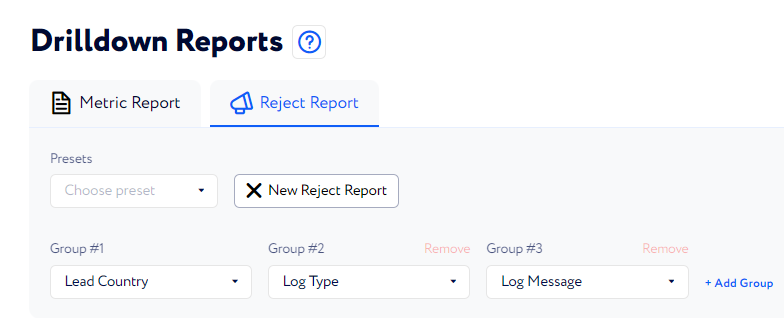
Note: Mind that in the generated report the following group is nested within the previous group. I.e., Group#3 is nested within Group#2, whereas Group#2 is nested within Group#1, etc.
Besides the "Group" section, there is an option to set up conditions to make a report more precise. You can select individual parameters as well as define their cooperation, i.e., if they are considered together (choose And) or either one or the other is considered (choose Or).
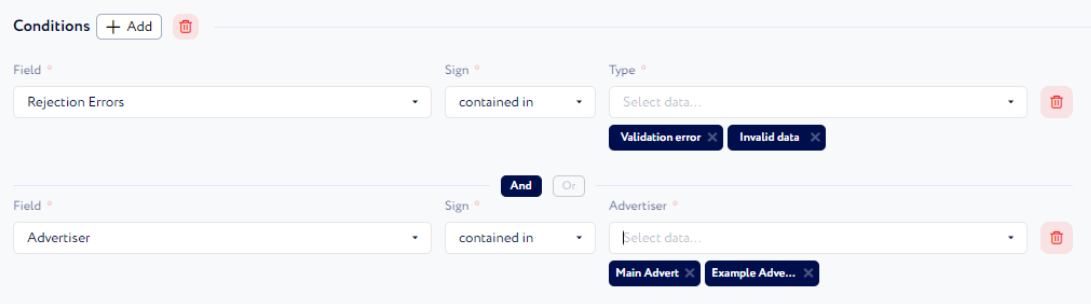
Important: All types of Rejection Errors are included in the report by default.
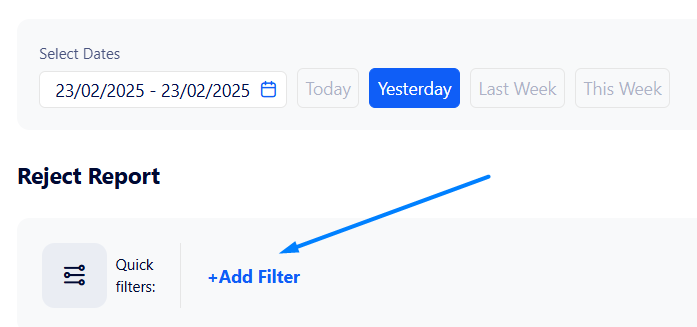
When you have customized your report, a time range for the report needs selecting.

You can either choose one of the preconfigured periods (last week, this week, etc.) or set up your own one with the "Select Dates" field.
Note: The maximum time range that can be set is 7 days.
Here, you can also apply quick filters to inveatigate a ceratin part of the.
To add a filter, click the "Add Filter" button as it is shown in the screenshot below.
Note: You can select up to 5 filters.
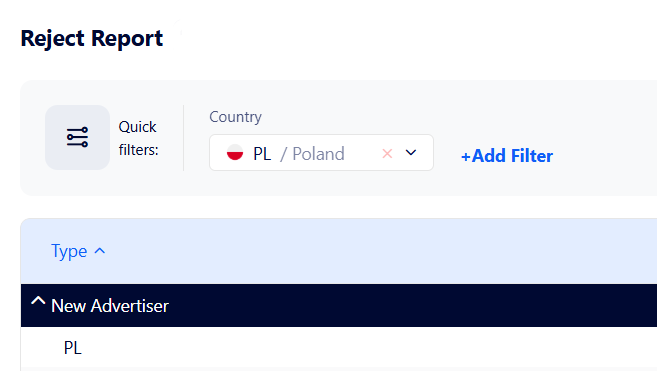
Example: If you want to view a particular country data, add the "Country" filter and select a necessary country.
You can also hide rows containing only zero values. The corresponding button appears once you have generated the report:
Additionally, you can expand or collapse all nested data in the generated report in one click. You can see the button highlighted in the screenshot below:
Also, you can create a preset based on the created report as well as schedule it to regularly receive updates. To do so, click the "Actions" button at the top of the page and select the required option.
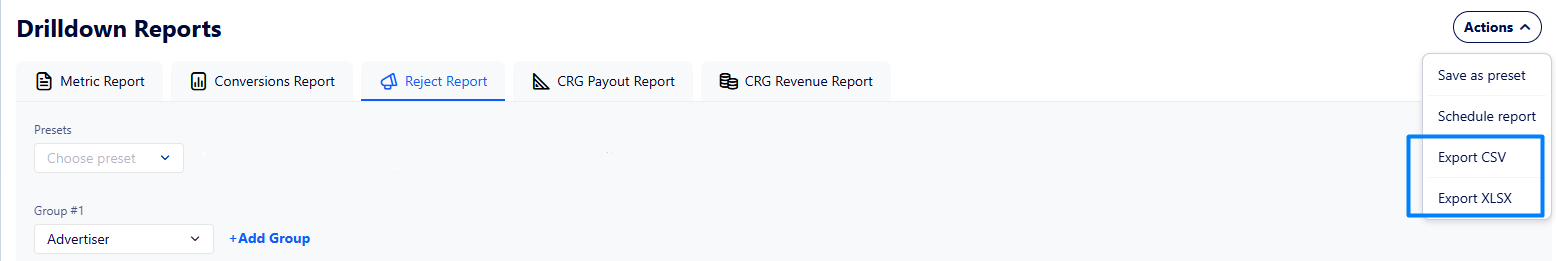
Moreover, you can download the generated report in CSV or XLSX format by clicking the respective option here:
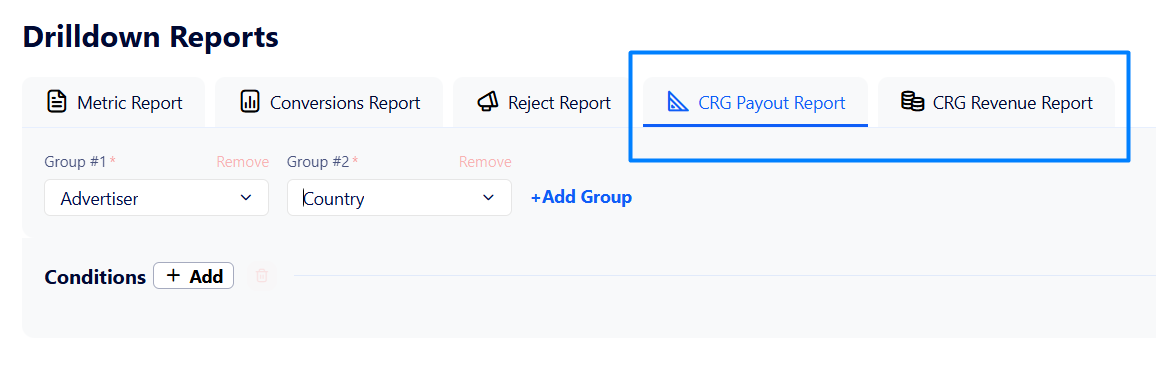
CRG Reports
CRG Payout and CRG Revenue reports allow you to view quick statistics on your CRG campaigns.
Report presets
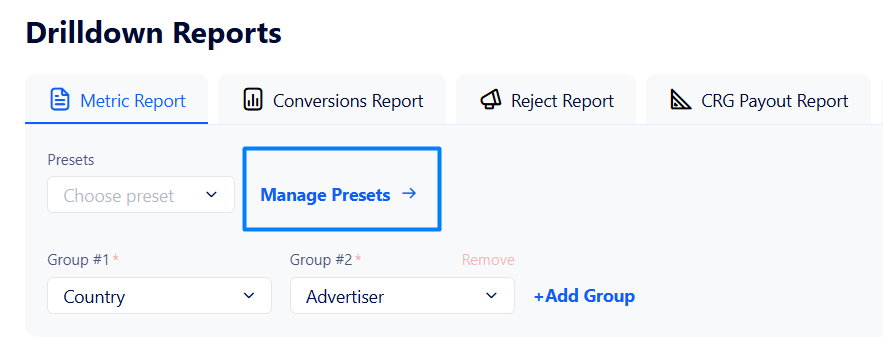
In order for a whole report customizing procedure for the reports to be smooth and time-saving, there is an option to create a preset – a preconfigured set of conditions and columns for generating a report quickly. To create a preset, click "Manage Presets".
Alternatively, you can create a preset based on a generated report. To do so, click the "Actions" button and select the "Save as preset" option.

Read this article to learn how to create a preset and use it for report generation.