
Tables deep dive
This article helps you to work with Traffic Data tables effectively.
In Traffic Data tables detailed information on incoming traffic is shown. For your convenience, the data is stored in separate corresponding tables arranged by a lead state (e.g., clicks, leads, FTDs). However, there is also another table on this tab, which combines all the information from these individual tables.
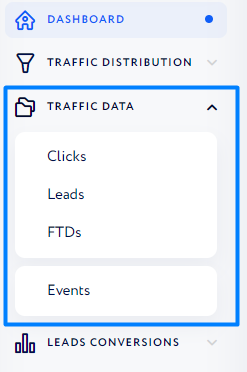
Once you expand the section, you may see default tables. If you want to customize them or add new ones, go to Settings Navigation → CRM Settings → Table Customization.
However, there is one table – Events – standing separately in the table list which cannot be edited or deleted. It accumulates all the traffic events happening across the system, meaning that you can find all lead states here.
Note: As all the tables in their essence have the same features and filters and differ only in lead states, let us describe all their functionality using the Events table as an example.
When you take a look at this page for the first time, you can see a table with preconfigured columns. If you want to add other columns, click the "Gear" button at the top right of the page.
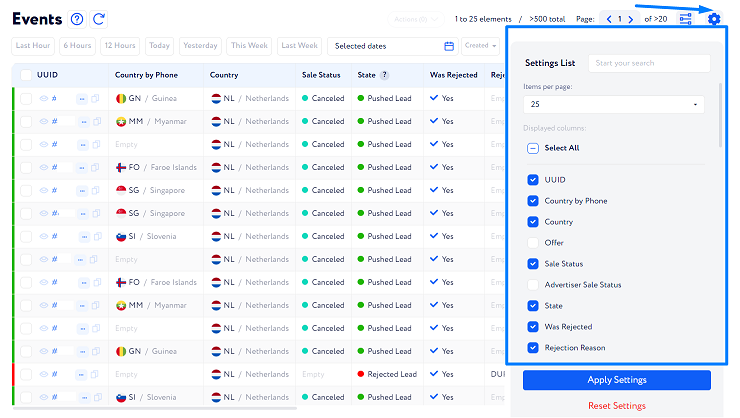
Check the box next to the column name you wish to add or uncheck it if this column is no longer needed. Also, you can drag column names up and down to change their location in the table: the higher the name in the list, the closer it is to the beginning of the table.
Important: If you want to monitor the data that is not on the list, you need to add a new item to Lead Profiles.
In this window, you can also set how many result lines you want to appear on a page. To do so, select the required number in the "Items per page" field.
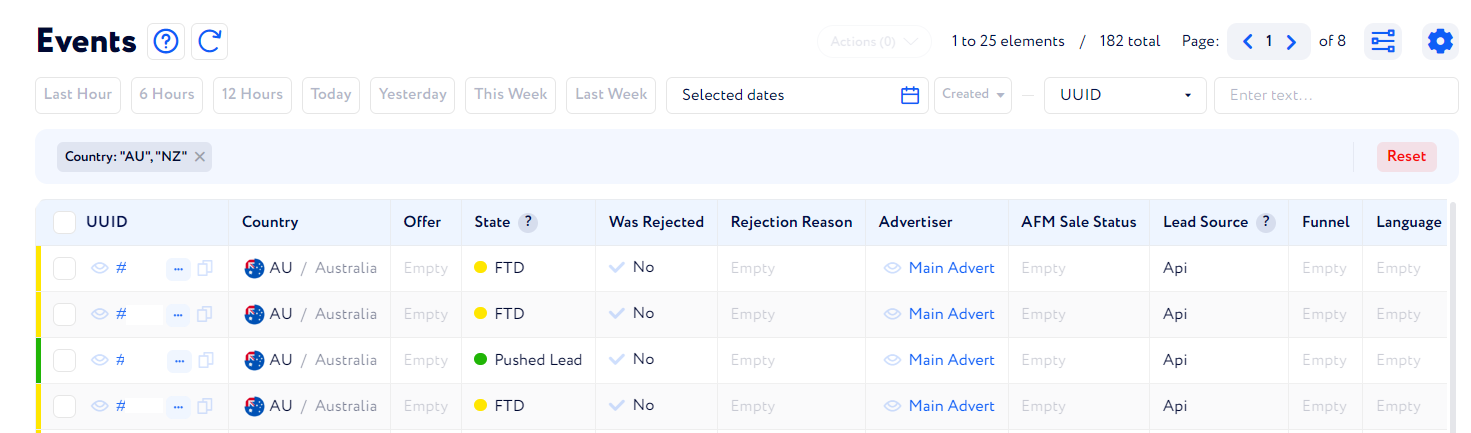
Besides, there is an option to filter traffic data that will be shown in the table on this page. If you need to look at specific traffic, for example, to set the particular period of time or advertiser, choose a certain country, study only rejected leads, etc., you can apply existing filters by clicking the button as highlighted in the screenshot below. Then, the filter list appears, where you can select necessary parameters to sort the traffic by.
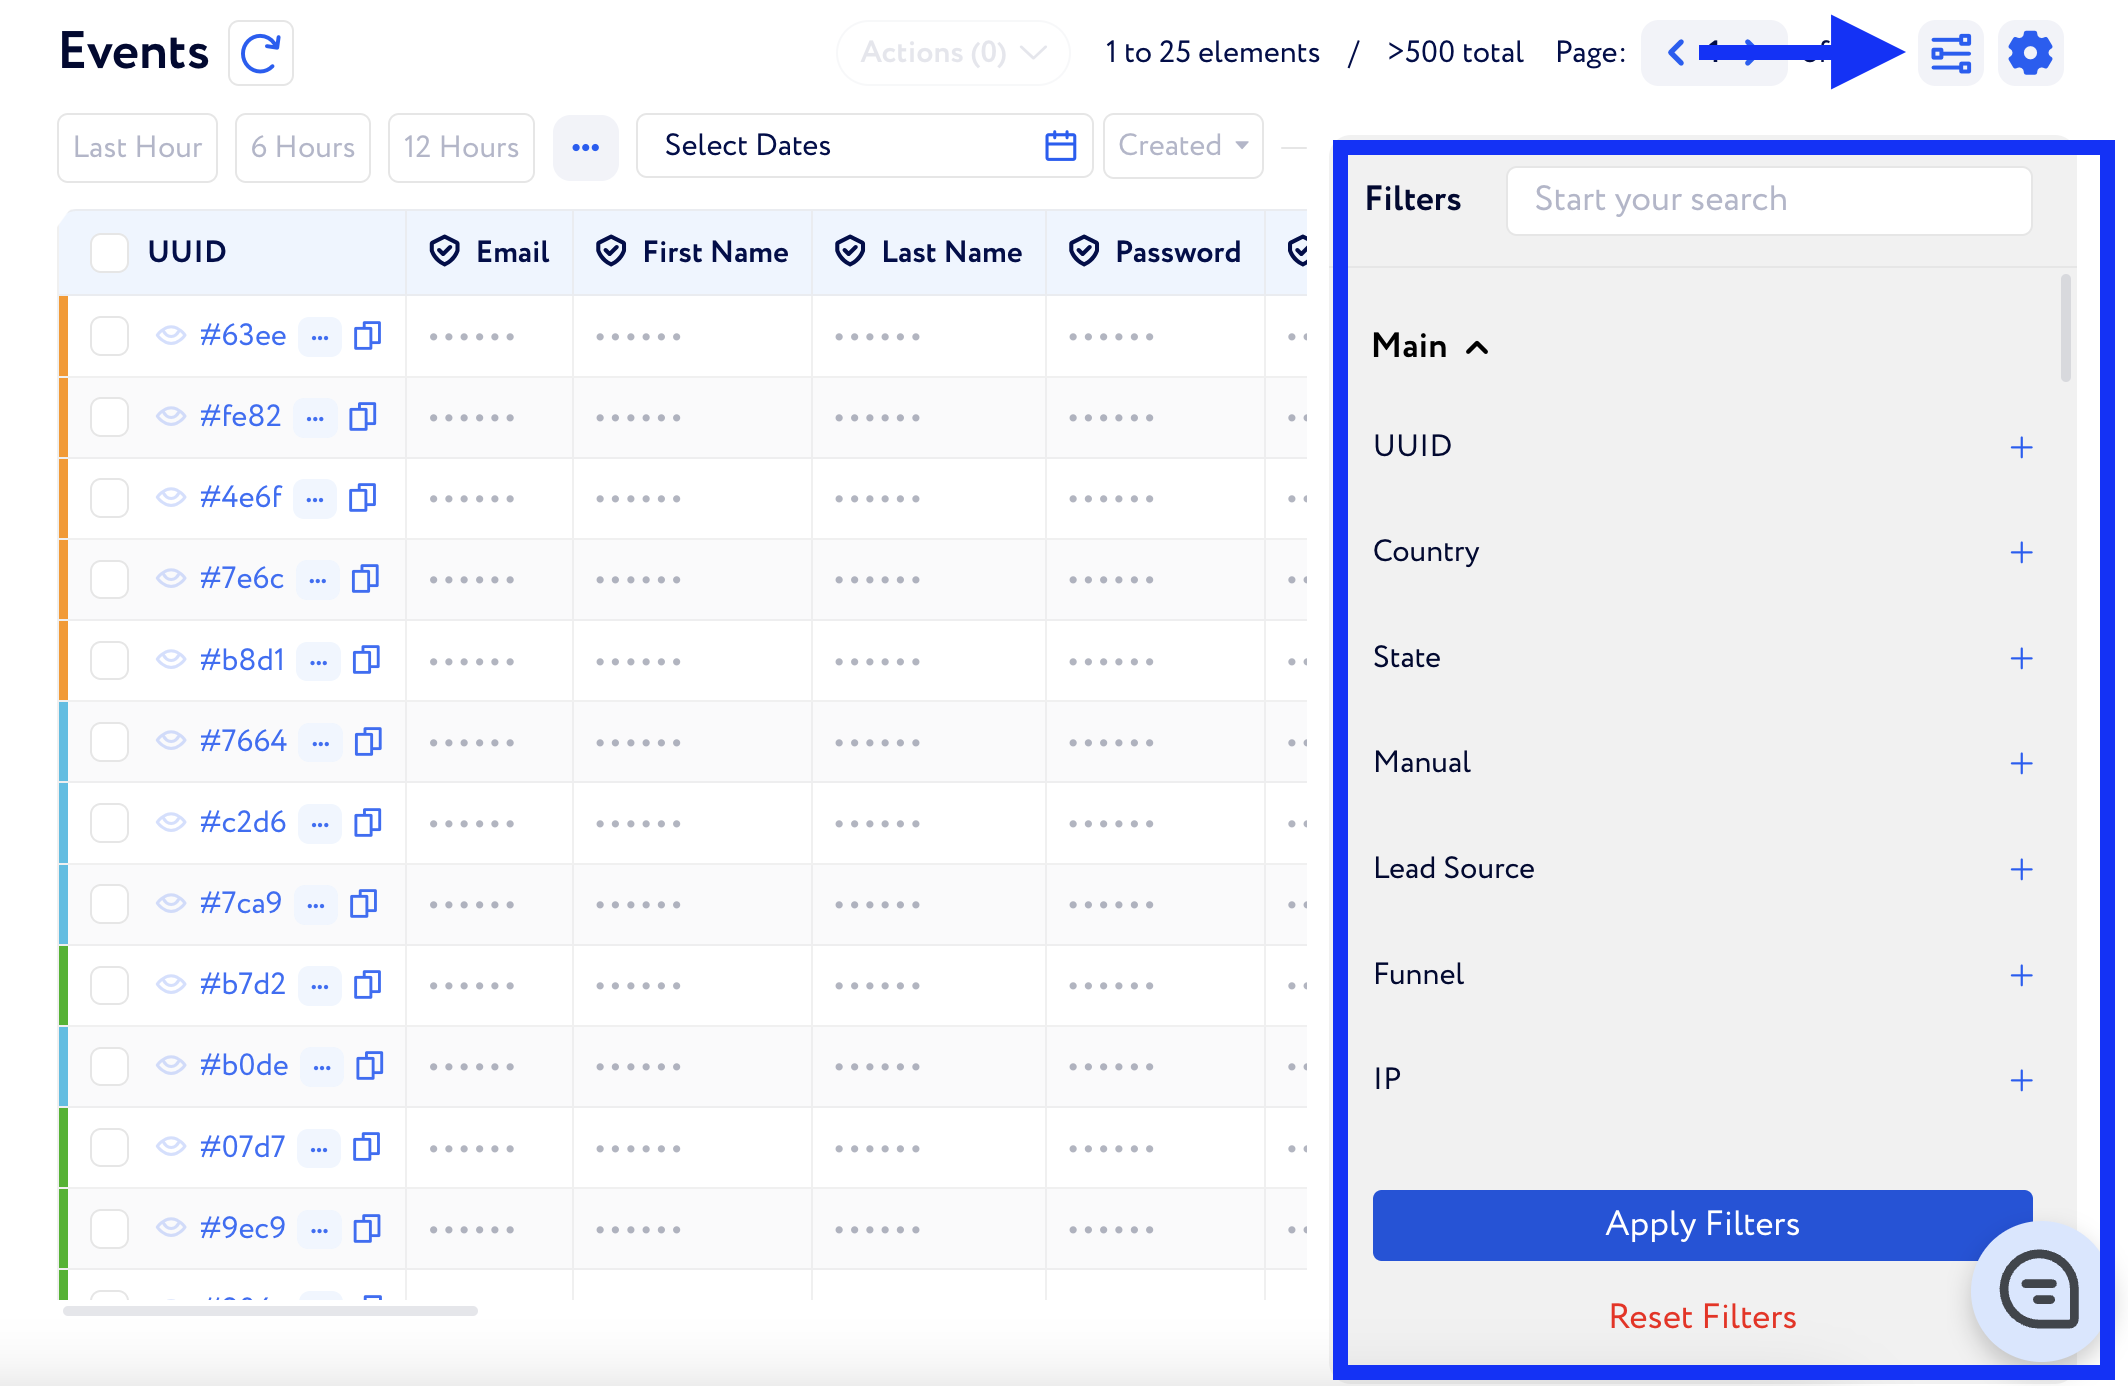
Once you click "Apply", all the chosen filters will be applied and you will only see the data that matches the filters.
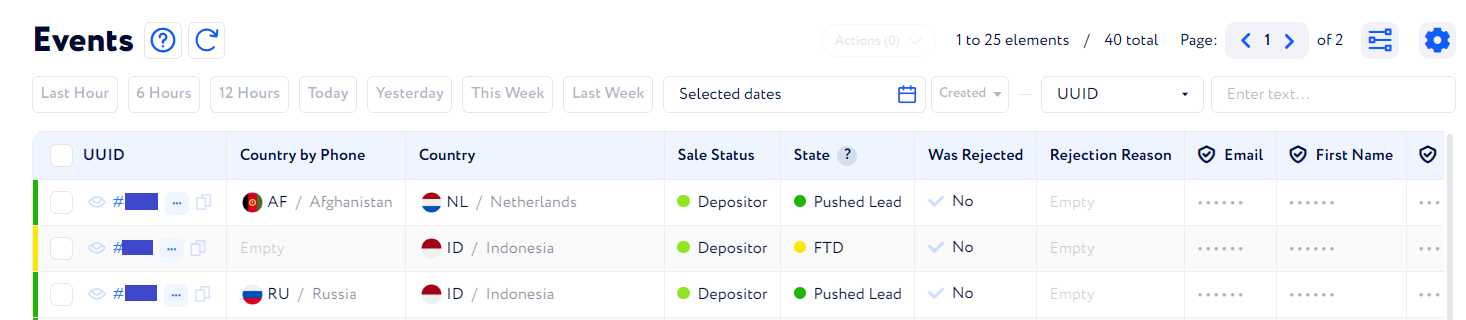
Example: If you want to only study rejected leads that came from Australia and New Zealand, the table may look like in the screenshot below.
There is another option to customize the table – using quick filters which are highlighted in the screenshot below:
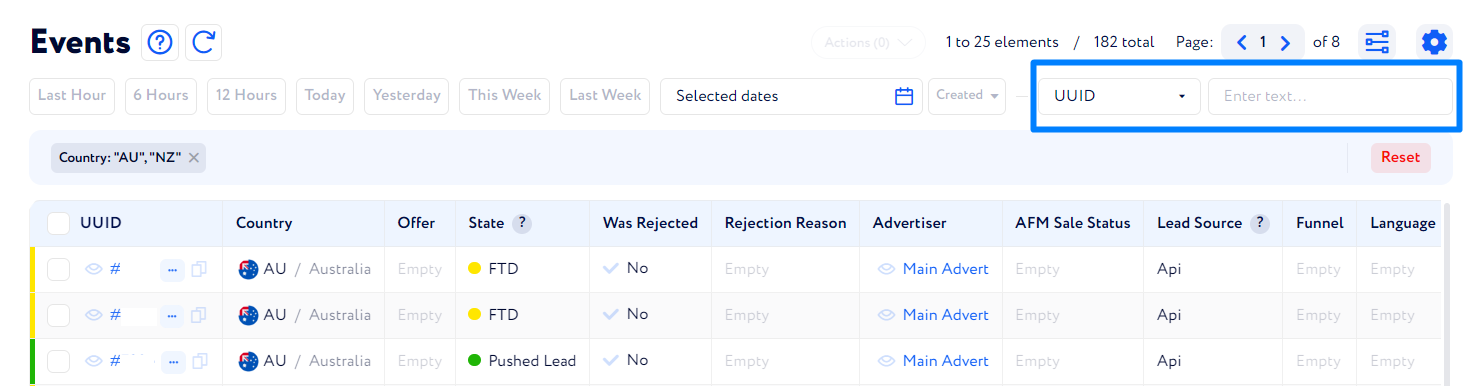
Choose a certain filter from the dropdown list in the field to the left, then select its value in the field to the right. Mind that this option has the restricted number of filters.
To reset all the filters, click "Reset".
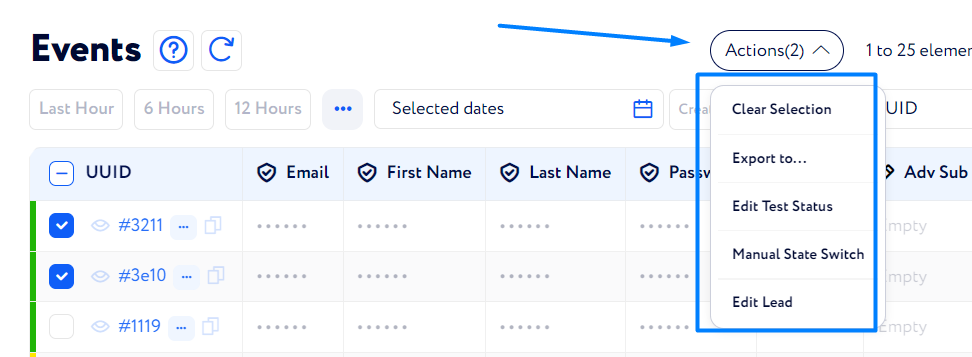
You can also perform the following manipulations with the traffic via these tables:
You can export the selected leads to Injections (to re-push them) or to Deals Updater (to change their Payout or Revenue values).
You can manage the selected leads sale status together.
You can manually switch all the selected leads sale status together.
Note: In this case, lead flow and state should be the same for all selected leads.You can edit certain lead fields data (ones you marked as editable when creating).
To do so, check the boxes next to required leads, click the "Actions" button on the top of the page, and select the action you want to make.
In addition to options mentioned above, you can quickly access the basic lead information along with its logs by clicking the "Eye" button in the "UUID" column next to the required lead line.
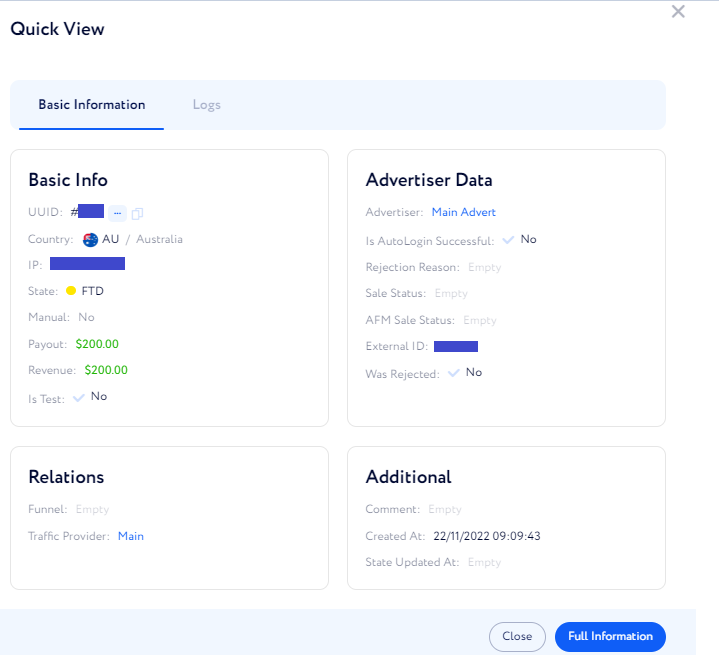
If needed, check lead full information when clicking "Full Information".
Once you click the button mentioned above, you will be transferred to a lead page which consists of the following tabs:
Basic Information
Pulling Information
Logs
You can find each tab description in this article.