Comparing Analytics
This tool allows you to compare Affiliates, Advertisers, Offers, Countries, and other entities in two different periods by various metrics.
For each added metric, there are three columns in the table: amount in the first period, amount in the second period, and difference between them (net amount).
The feature supports the following actions:
Selecting two custom periods for comparison.
Selecting several metrics for the report.
Customizing the list of available metrics.
Sorting table by any column(check top affiliates).
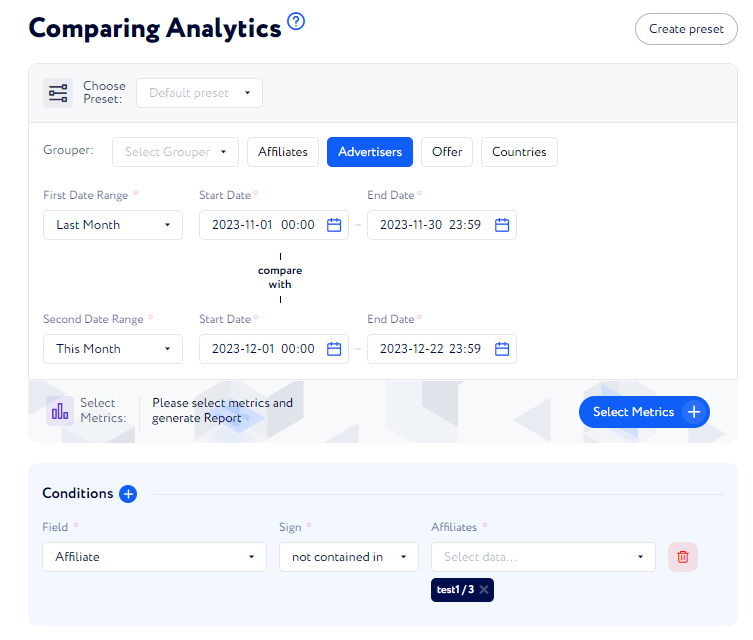
Grouper – every line of the report presents metrics for each entity, whether it’s an affiliate, an advertiser, an offer or a country. Other groupers are collected in the drop-down list. Grouper defines what data is shown in the first column of the report.
First Date Range – metrics from this timeframe will be compared to the metrics from the Second Date Range.
Select Metrics – choose the metrics for which you want to compare historical records.
Conditions – filter data that should be present in the report.
How to check results?
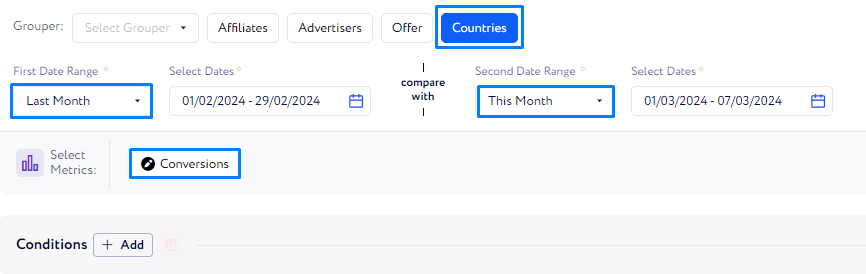
Let's run the Comparing Analytics to find out where the majority of traffic is coming from and compare results with historical data to see the dynamics.
With this goal in mind, let's select Countries to compare traffic geolocations. To get plenty of data, we select monthly results. Finally, let's add metrics that we will use to measure results: conversions.
Click Compare to view the results.
When a table appears, we can click column headers to sort the items either by the lowest or the highest value. Here, the arrow in the “Conversions (Last Month)” column indicates that items are sorted in descending order (from the highest to the lowest).
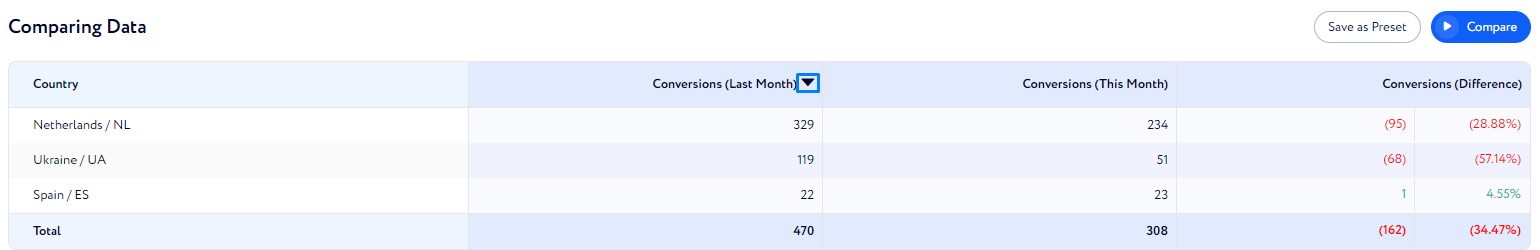
For each metric three column appears in the table:
Value in the first period.
Value in the second period.
The difference between them.
If you have chosen several metrics, scroll the table sideways to check data on all the included metrics: